Chart of the Week: The Risk Trade
Lately I have been talking about the flight-to-safety trade in posts such as Revisiting the Flight-to-Safety Trade. In thinking about various flight-to-safety low risk havens I tend to focus on U.S. Treasuries, the dollar (UUP) and gold (GLD).
Turn the flight-to-safety trade upside down and essentially what we are looking at is the risk trade. There are many ways to think about the risk trade (growth vs. value, emerging markets vs. developed markets, consumer discretionary vs. consumer staples, etc.) but for a broad and simplified perspective on the risk trade I like to focus on market capitalization. Specifically, I like to follow the ratio of the small cap Russell 2000 index (RUT) to the mega cap S&P 100 index (OEX).
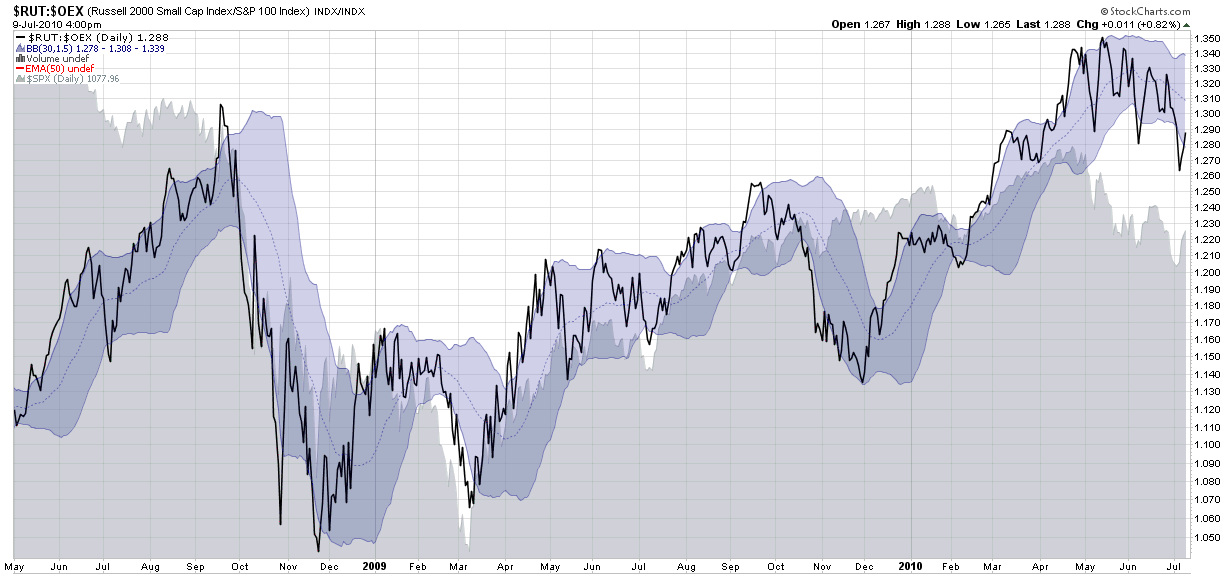
This week’s chart of the week below shows the RUT relative to the OEX (black line) since May 2008, with a gray area chart of the S&P 500 index added for context. Also included in the chart are Bollinger Bands that use customized settings of 30 days and 1.5 standard deviations (for more information on using something other than the default 20 days and 2.0 standard deviations, see the links below.) The result is a chart that tells me when the RUT:OEX ratio is high in absolute terms or relative to recent values.
If stocks are in the process of moving into an trading range (i.e., as suggested in The Elusive Trading Range), then investors should be thinking about transitioning from indicators that measure trend strength to indicators such as oscillators that measure how much various asset classes are overbought oversold.
When it comes to stocks, an important part of understanding momentum and reversal opportunities in either trending or trendless markets it to look at various proxies for the risk trade. For me at least, a good place to start is the RUT:OEX ratio and lately that ratio has done a solid job of identifying overbought and oversold conditions in stocks.
For more on related subjects, readers are encouraged to check out:
- Capitalization and Bullishness
- A Baker’s Dozen of Favorite Indicators
- Revisiting the Flight-to-Safety Trade
- Chart of the Week: The Flight-to-Safety Trade
- Bollinger Bands: Why Use 20 Days?
- Bollinger Bands and the Standard Deviation Setting
Disclosure(s): none

